DIFFERENTIAL PRESSURE MEASUREMENT ACROSS LIQUID FILTERS IN A BEVERAGE PROCESSING PLANT
SYSTEM REQUIREMENT:
Measure the pressure drop across each filter in a bank of filters to determine when to switch to a fresh filter(s) so the clogged one(s) can be cleaned.
Provide electrical isolation between each input signal as well as between input to output to prevent noise pickup and noise from ground loops.
Wilkerson Instrument Co. Products Used
| MM4408 | MM4300 | LP4OO |
| TWO-INPUT ISOLATED DC DIFFERENCE TRANSMITTER (OUTPUT = A – B) | ISOLATED SIGNAL CONDITIONER | LOOP POWERED DISPLAY |
| Specification PDF | Specification PDF | Specification PDF |
| I/O Manual PDF | I/O Manual PDF | I/O Manual PDF |
| How To Order | How To Order | How To Order |
SYSTEM SYNOPSIS
Many beverage processing plants utilize filters at various stages of the process to remove unwanted materials from the liquid. As these filters load up doing their job, the flow passing through the filter is reduced. If the filters are not replaced or cleaned, the flow can be impeded enough to disrupt the total process.
This particular application surfaced when the customer was faced with replacing an old pneumatic system. The customer wanted to install an electronic system using strictly “off-the-shelf” commercially available equipment. He was faced with very limited control panel space and limited budget. Therefore, the system must use the fewest components possible and the smallest displays available.
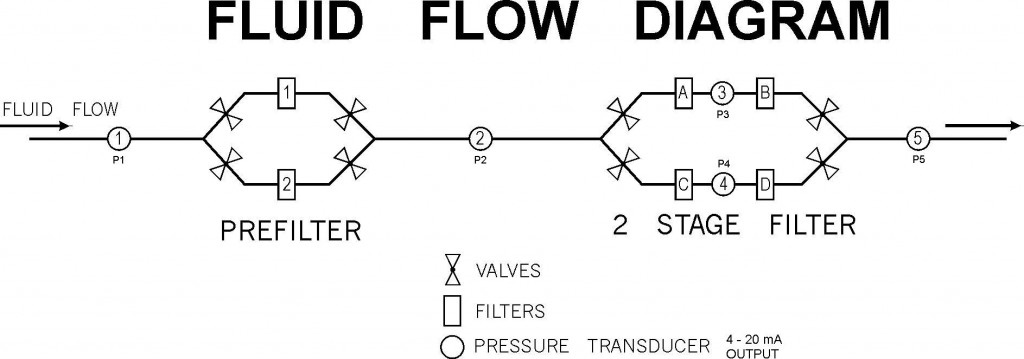
The Fluid Flow Diagram shows the basic arrangement of the pressure transducers and the filters. Only one prefilter and one two-stage filter are in service at any given time.
This allows the other filter(s) to be cleaned, sterilized and made ready for service.
USDA approved pressure transducers that are cleaned and sterilized in place were selected. By placing transducers 1, 2 and 5 so their use is common to either prefilter and either filter bank in use, the customer needed only five pressure transducers to do the job.
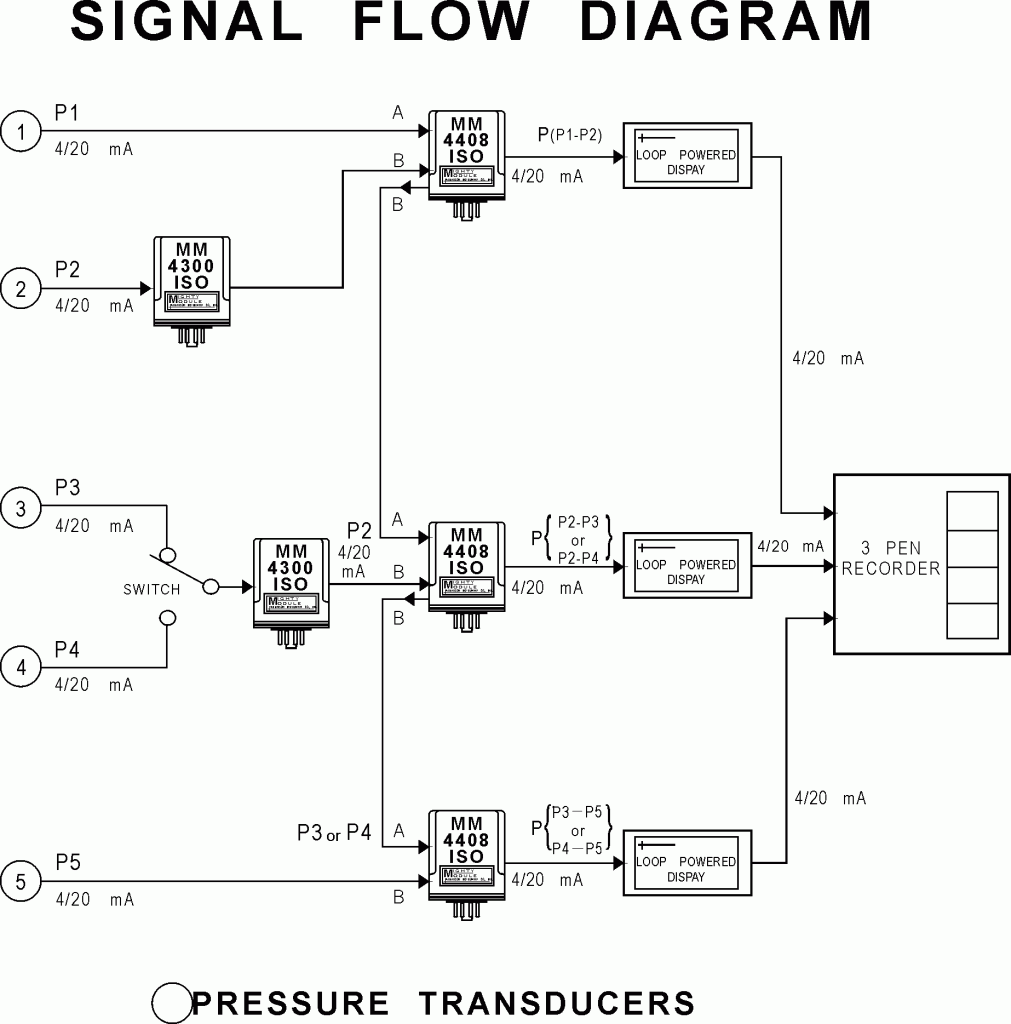
The Signal Flow Diagram shows how the customer’s judicious use of a switch, two MM4300 DC to DC transmitters, and three MM4408 difference transmitters achieves the needed input to input and input to output signal isolation with only five modules.
SOLUTION
The product chosen to measure the differential pressure (pressure drop) across the filter was the MM4408 and the MM4300.
The MM4408 inputs are not isolated from each other, but the output is isolated from both inputs.
The MM4300 signal conditioner has isolation from the input to output. It is used to provide one input to the MM4408. This provides isolation for both inputs.
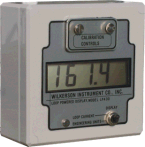
Three LP400 loop powered displays in series with the three 4/20mA outputs provides an indication of the pressure on the output of the filters. The Display can be calibrated in engineering units to fit the need.
Wilkerson Instrument Company Inc Is a solutions provider for signal conditioning and process control instrumentation – Copyright 2012

